A new way to measure wealth in the Kansas City region

Oct 05, 2026
| Posted in
Four different colored game pieces on stacks of coins of varying height.

Two households may earn the same income but have very different abilities to get ahead or weather a financial setback. The question is where that money goes: toward building assets through a mortgage or 401(k), or toward paying debts such as student loans or medical bills. 

Until now, these differences have been difficult to measure at the local level. Most available data captures what a household makes, not accounting for other financial resources that keep families afloat.

A new local wealth analysis developed by Open Wealth Consortium in collaboration with MARC paints a more detailed picture of household wealth across the Kansas City region. 

How big is the gap?

Income is how much you earn. Wealth is how much you have. Wealth is the net worth of a household — their balance sheet of what they own (assets) minus what they owe (liabilities or debts). When the debt exceeds what a household has, it puts a household in a difficult financial position.

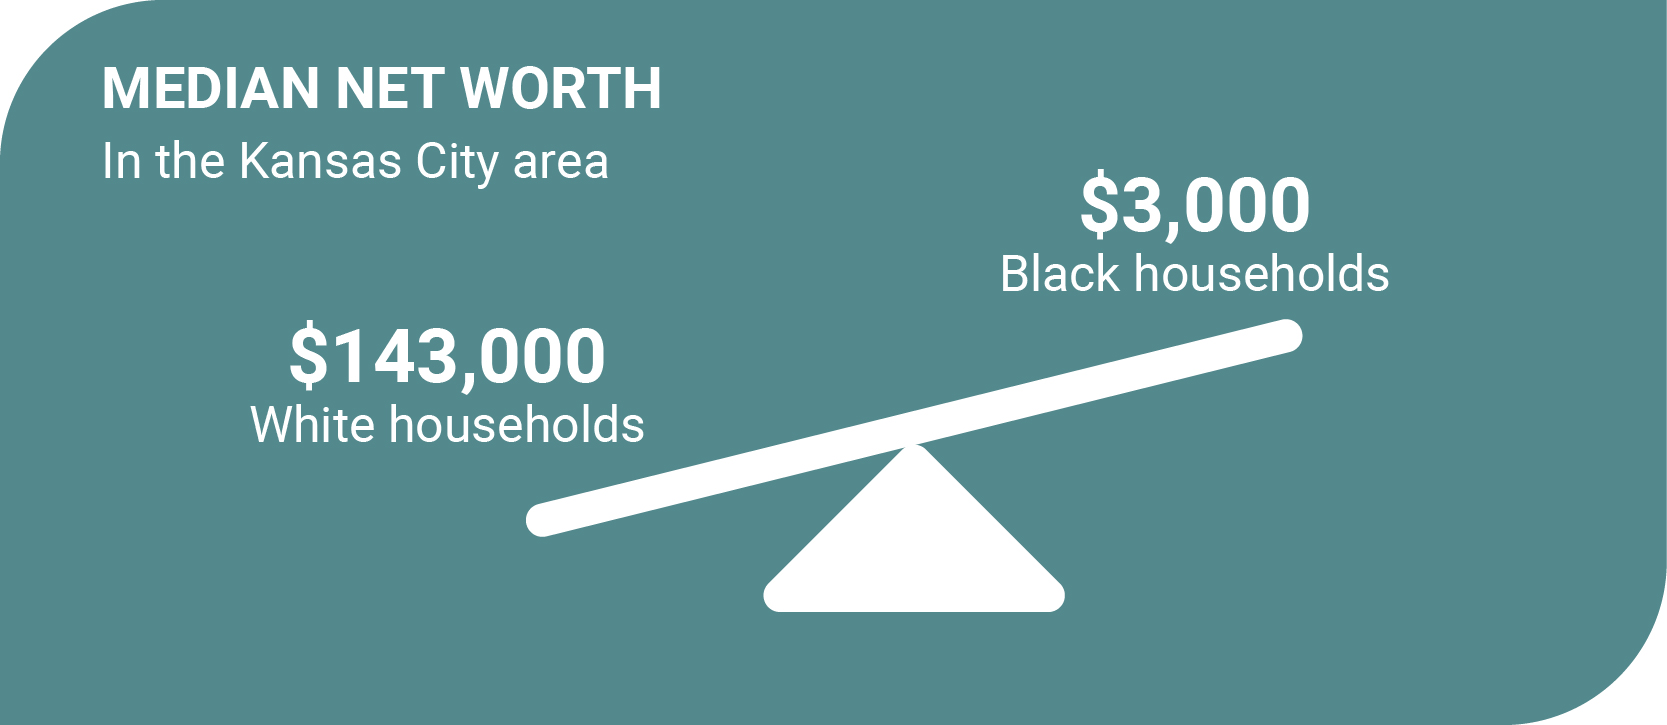
A graphic of an unbalanced scale showing the household median net worth of white households at $143,000 versus Black households at $3,000.
Open Wealth Consortium, 2018 estimates

The typical white household in the Kansas City area holds about $143,000 in net worth. The typical Black household holds about $3,000, a gap of roughly 43-to-1. For Hispanic households the figure is about $13,000, an 11-to-1 gap.

Does the gap grow over time?

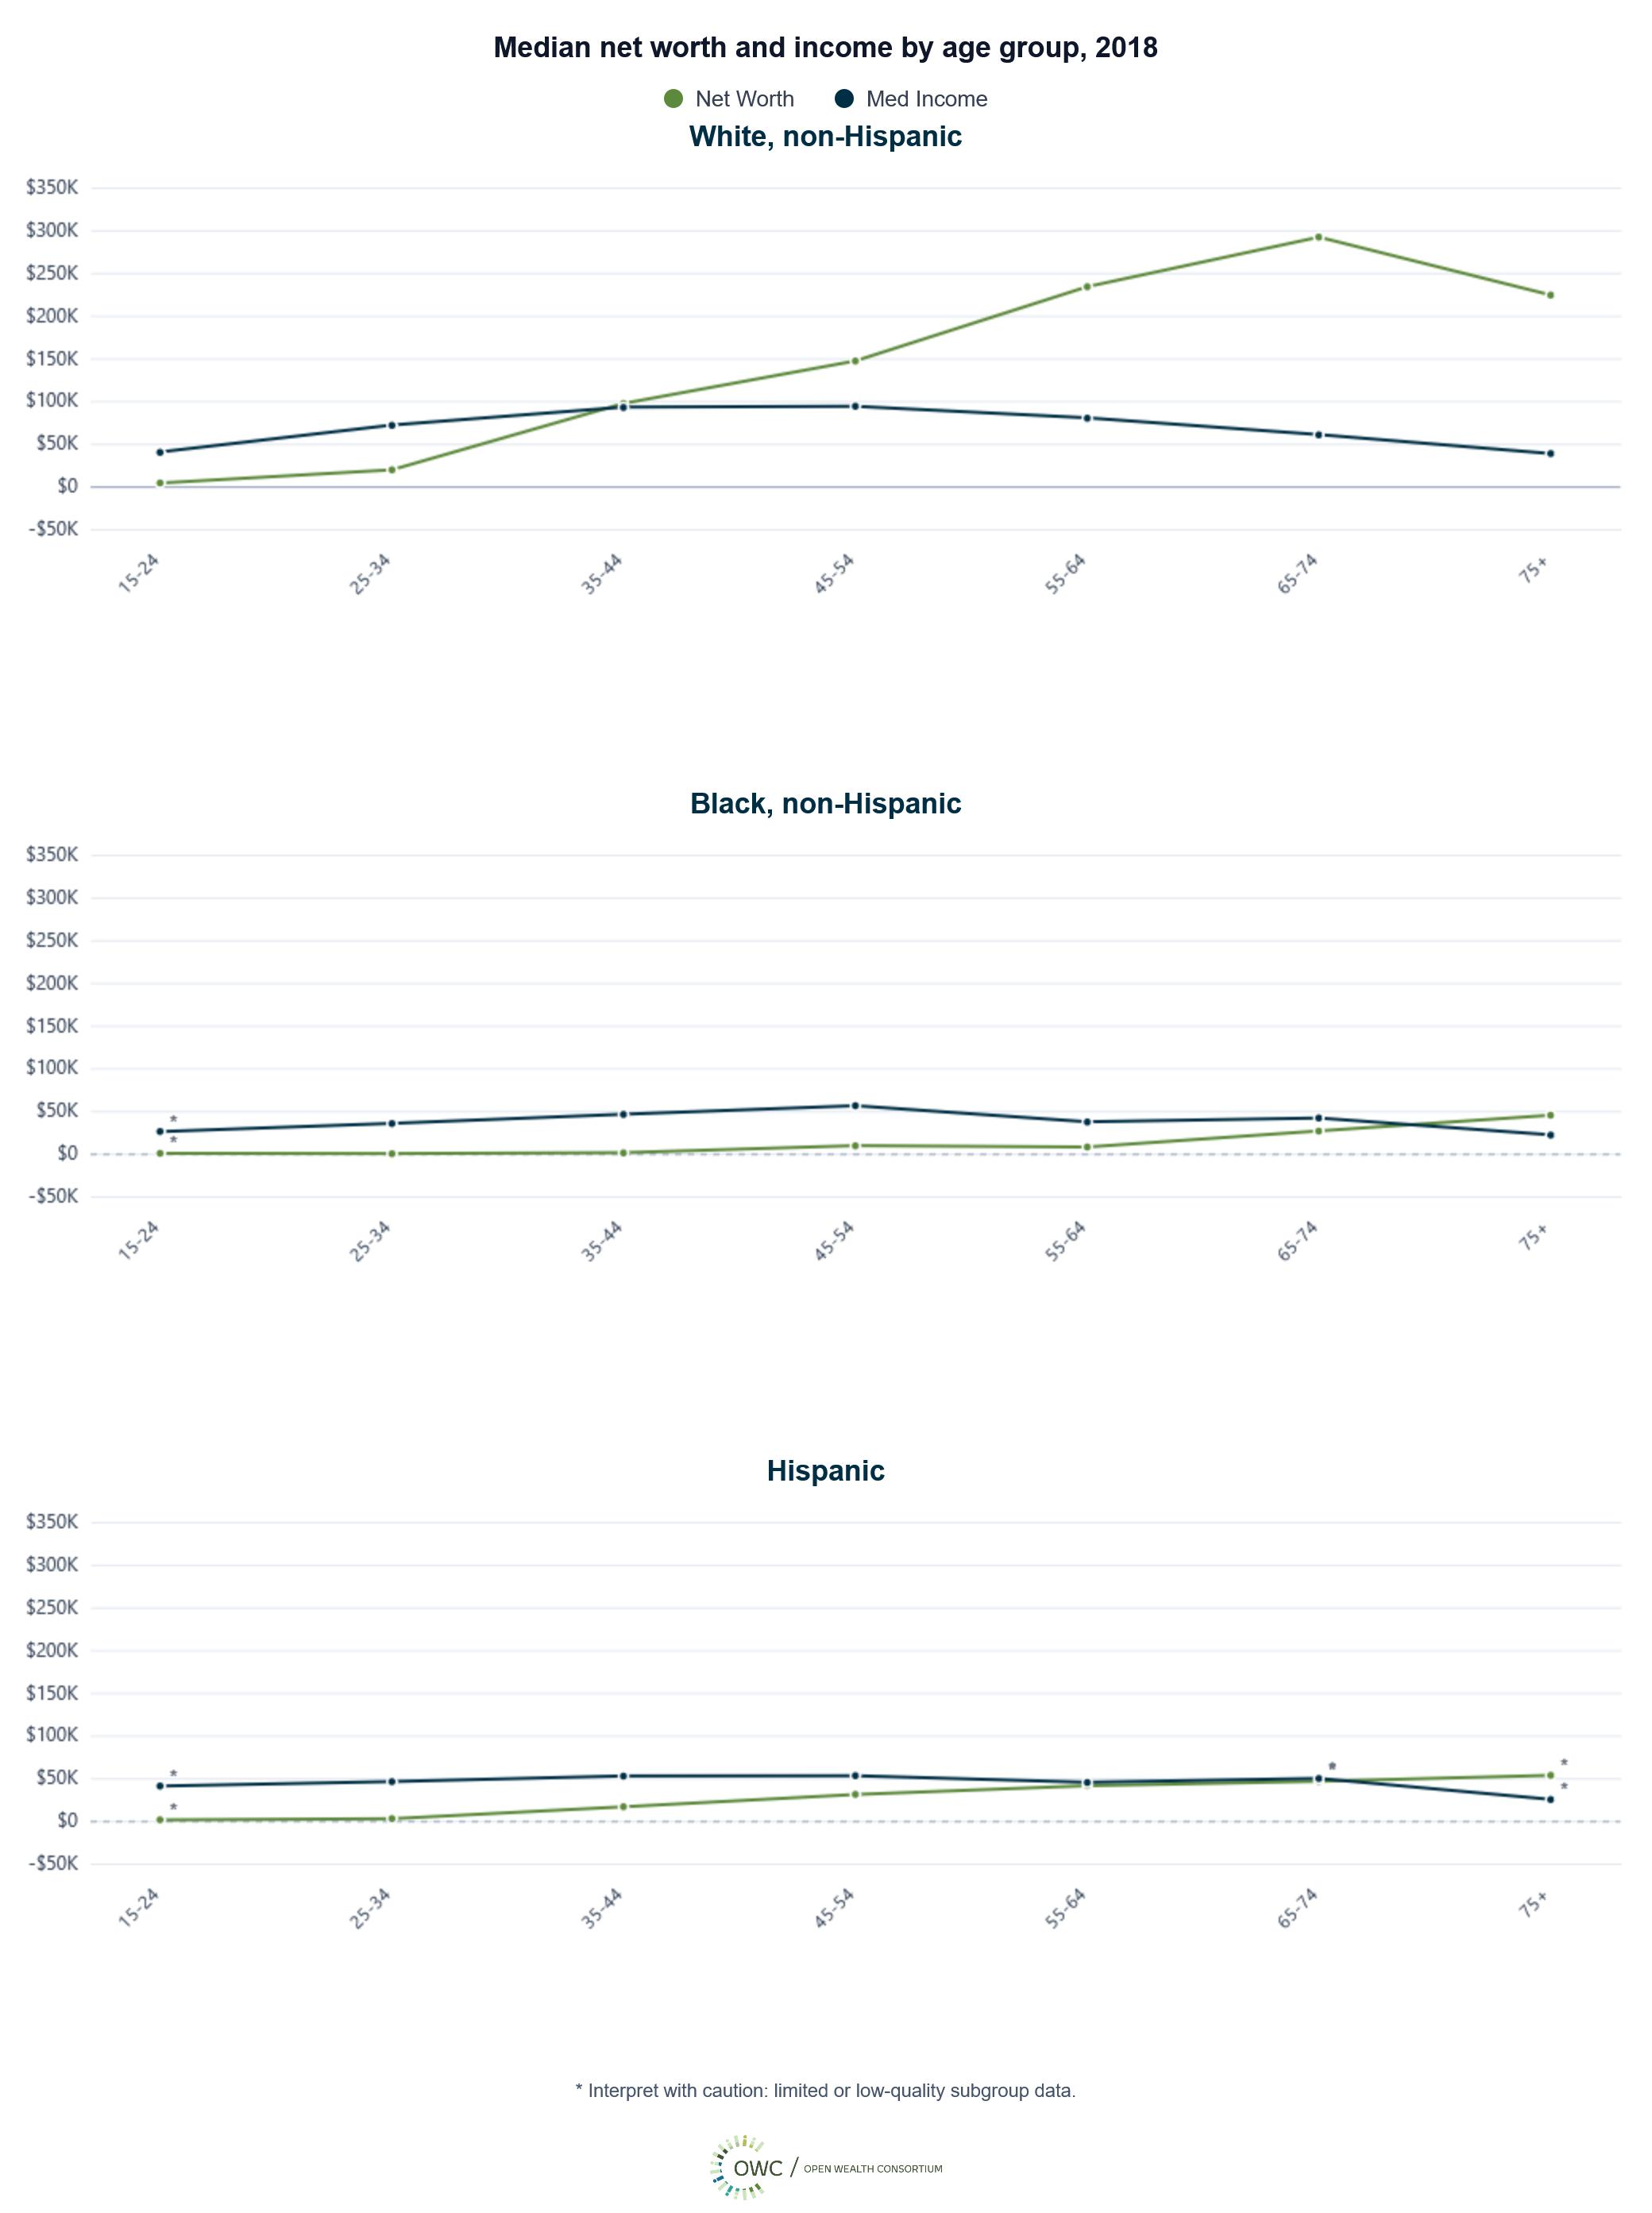
While income tends to peak between ages 35 and 54, wealth builds over a lifetime, widening the differences in net worth across racial and ethnic groups with age. White households build wealth exceeding income in their prime earning years; Black and Hispanic households don’t until their 70s.

Households living paycheck to paycheck into their later years are less financially resilient if disaster strikes or live off into retirement age if they can no longer work.

A chart highlighting large wealth gaps, especially at older ages, despite smaller differences in income.

Learn more

The analysis does not prescribe solutions, but it gives regional partners a common starting point to understand how their work fits into improving wealth equity in the region.

You can explore charts on wealth by race, age, education and homeownership, including an interactive version of the chart above, at the Open Wealth Consortium website.

About the data

Estimates come from the Open Wealth Consortium, which combines federal data sources to approximate wealth at the metro level. Figures reflect 2018, the most recent year of high-quality source data. Estimates for Hispanic, Asian and other households draw on smaller samples and should be read with more caution.